
🚀 Quick Overview
- The Problem: Manually combining monthly sales files.
- The Solution: A Python script that merges, cleans, and sums data.
- Libraries:
pandasandopenpyxl. - Time Saved: Hours per month.
If you work in an office, you probably know the “End of Month” pain. You get three different CSV files (Sales_East.csv, Sales_West.csv, Sales_North.csv), and you have to open each one, copy the rows, and paste them into a Master Excel Sheet.
Then you have to run a VLOOKUP, create a Pivot Table, and email it to your boss.
Stop doing that. Today, we are going to write a Python script that does all of that in 0.5 seconds.
Step 1: The Setup
We need the Pandas library (which we benchmarked on Monday!) and OpenPyXL to talk to Excel files.
pip install pandas openpyxlStep 2: The Scenario
Imagine you have a folder with several sales files. We want to:
- Combine them all into one big table.
- Calculate the “Total Revenue” (Price * Quantity).
- Export a clean summary report to Excel.
Step 3: The Setup (Get the Data)
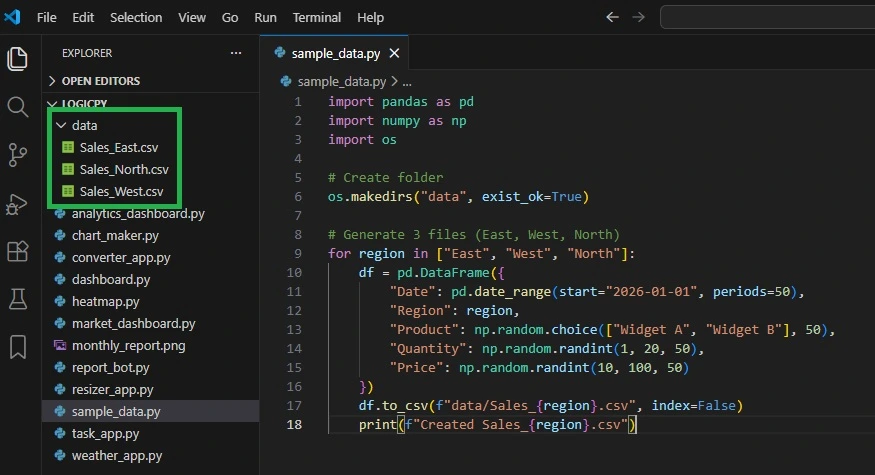
To make this work, we need some messy files to clean up. You can create them manually, or just run this quick script to generate 3 dummy sales files instantly:
import pandas as pd
import numpy as np
import os

# Create folder
os.makedirs("data", exist_ok=True)

# Generate 3 files (East, West, North)
for region in ["East", "West", "North"]:
    df = pd.DataFrame({
        "Date": pd.date_range(start="2026-01-01", periods=50),
        "Region": region,
        "Product": np.random.choice(["Widget A", "Widget B"], 50),
        "Quantity": np.random.randint(1, 20, 50),
        "Price": np.random.randint(10, 100, 50)
    })
    df.to_csv(f"data/Sales_{region}.csv", index=False)
    print(f"Created Sales_{region}.csv")
Run that once, and you will see a new data/ folder appear with your CSV files. Now, let’s write the automation bot.
Step 4: The Code
Create a file named report_bot.py and paste this code:
import pandas as pd
import glob
import os
from datetime import datetime
# 1. Find all CSV files in the 'data' folder
# (Make sure you create a folder named 'data' and put some dummy CSVs in it!)
all_files = glob.glob("data/*.csv")
print(f"Found {len(all_files)} files to merge...")
# 2. Combine them into one DataFrame
# This replaces opening files and copy-pasting manually
df_list = []
for filename in all_files:
data = pd.read_csv(filename)
df_list.append(data)
# Merging everything
master_df = pd.concat(df_list, ignore_index=True)
# 3. Perform Calculations (The "Excel Formulas")
# Instead of =B2*C2, we just do this:
master_df['Total_Revenue'] = master_df['Price'] * master_df['Quantity']
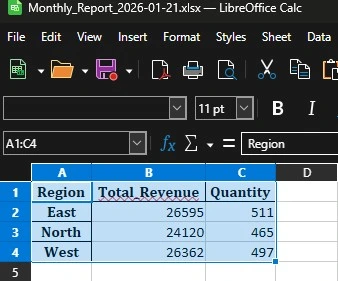
# 4. Create a Summary Pivot Table
summary = master_df.groupby('Region')[['Total_Revenue', 'Quantity']].sum()
# 5. Export to a professional Excel file
timestamp = datetime.now().strftime("%Y-%m-%d")
output_filename = f"Monthly_Report_{timestamp}.xlsx"
# We use ExcelWriter to save multiple sheets
with pd.ExcelWriter(output_filename, engine='openpyxl') as writer:
summary.to_excel(writer, sheet_name='Executive Summary')
master_df.to_excel(writer, sheet_name='Raw Data', index=False)
print(f"✅ Success! Report saved as {output_filename}")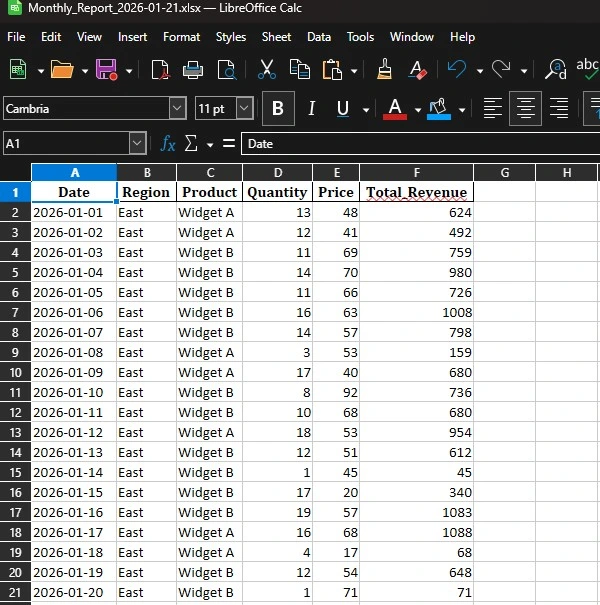
Why This is Better than Excel Macros (VBA)
You might ask, “Can’t I just use a Macro?” You can, but Python is superior because:
- It handles big data: Excel crashes after 1 million rows. Python (especially with Polars) handles millions easily.
- It’s readable: Python code is easier to read than VBA.
- It’s external: You don’t need to open the Excel app to run the script. You can schedule it to run automatically in the background.
Conclusion
You have just automated a boring task. Now, instead of copy-pasting, you can spend your time analyzing the data (or getting coffee).
Next Challenge: Can you modify this script to email the report automatically? Check out our Email Automation Guide to learn how.