⚡ The Golden Rule
“Data visualization is about communication, not art.”
Your goal is to make the data understood as quickly as possible. If the reader has to squint, guess, or do math in their head, the chart has failed.
You have learned Matplotlib. You have mastered Seaborn. You have even built interactive dashboards with Plotly.
But with great power comes great responsibility.
A beautiful chart is useless (or even dangerous) if it misleads the reader. Today, we are looking at the 7 most common mistakes beginners make—and how to fix them.
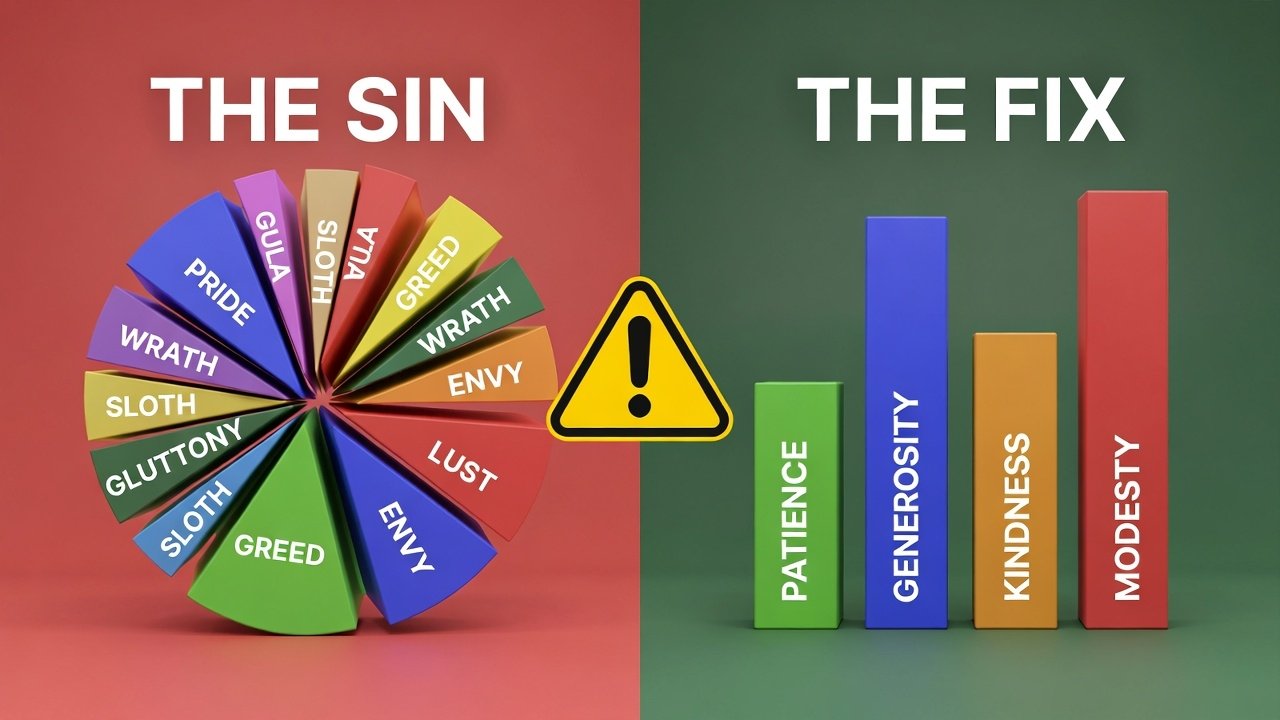
Sin #1: The 3D Exploding Pie Chart 🥧
This is the most hated chart in the data science world.
The Problem: 3D distorts perspective. The slice at the “front” of the 3D pie always looks bigger than the slice at the back, even if they are the same size. Adding an “explosion” (separating the slices) makes it even harder to compare angles.
The Fix: Use a simple Bar Chart. Humans are much better at comparing the length of bars than the angles of a circle.
Sin #2: Truncating the Y-Axis 📉
This is how people lie with data.
The Problem: If you start your Y-axis at 50 instead of 0, a small difference looks huge. If one bar is at 52 and another is at 54, the second bar looks double the size of the first, even though it’s only a 4% increase.
The Fix: For bar charts, always start at zero. If you are using a Line Chart to show small trends (like stock prices), a truncated axis is acceptable, but label it clearly.
Sin #3: “Clown Vomit” Colors 🌈
The Problem: Using 10 different bright colors for 10 different categories. It hurts the eyes and distracts the reader.
The Fix: Use one color (e.g., blue) for all bars. Then, use a distinct color (like dark blue or red) to highlight only the most important bar (the insight you want the user to see).
Sin #4: Chart Junk 🗑️
The Problem: Clutter. Heavy gridlines, thick borders, background gradients, and shadow effects. Edward Tufte, the father of data viz, calls this “low Data-Ink Ratio.” You are using too much ink on decoration and not enough on data.
The Fix: Minimalism. Remove the border. Make gridlines light gray and dotted. Remove the background color.
Sin #5: The Spaghetti Chart 🍝
The Problem: A line chart with 10+ lines all overlapping each other. It looks like a plate of spaghetti. You can’t tell which line is which.
The Fix: Use “Small Multiples” (Faceting). Instead of one big chart, create 10 small charts side-by-side. In Python/Seaborn, you can do this easily with sns.relplot(kind="line", col="category").
Sin #6: Unlabeled Axes 🏷️
The Problem: A chart showing a bar at “500.” Is that 500 Dollars? 500 Visitors? 500 Tacos?
The Fix: Never assume the context is obvious.
- Add a clear Title (e.g., “Revenue per Month”).
- Label the Y-Axis (e.g., “Revenue ($)”).
- Label the X-Axis (e.g., “Month”).
Sin #7: Inconsistent Scales 🍎🍊
The Problem: Placing two charts side-by-side to compare them, but giving them different scales. Chart A goes from 0-100, and Chart B goes from 0-1000. A user glancing at them might think the bars are the same size.
The Fix: If charts are meant to be compared, force them to share the same axis limits.
Conclusion
Data visualization is about trust. If you violate these rules, your readers might think you are trying to trick them.
Now that you know the rules, you are ready for the final boss.
Tomorrow (Friday): We wrap up Data Viz Week by building the ultimate project: a Real-Time Stock Market Dashboard that combines APIs, Plotly, and these design principles into one masterpiece.