⚡ Why Switch to Python?
- It’s Reproducible: If your data changes next month, you just re-run the script. No more clicking and dragging in Excel.
- It’s Beautiful: Python libraries offer professional, publication-quality styles out of the box.
- It’s Fast: Process 1 million rows in seconds, while Excel crashes.
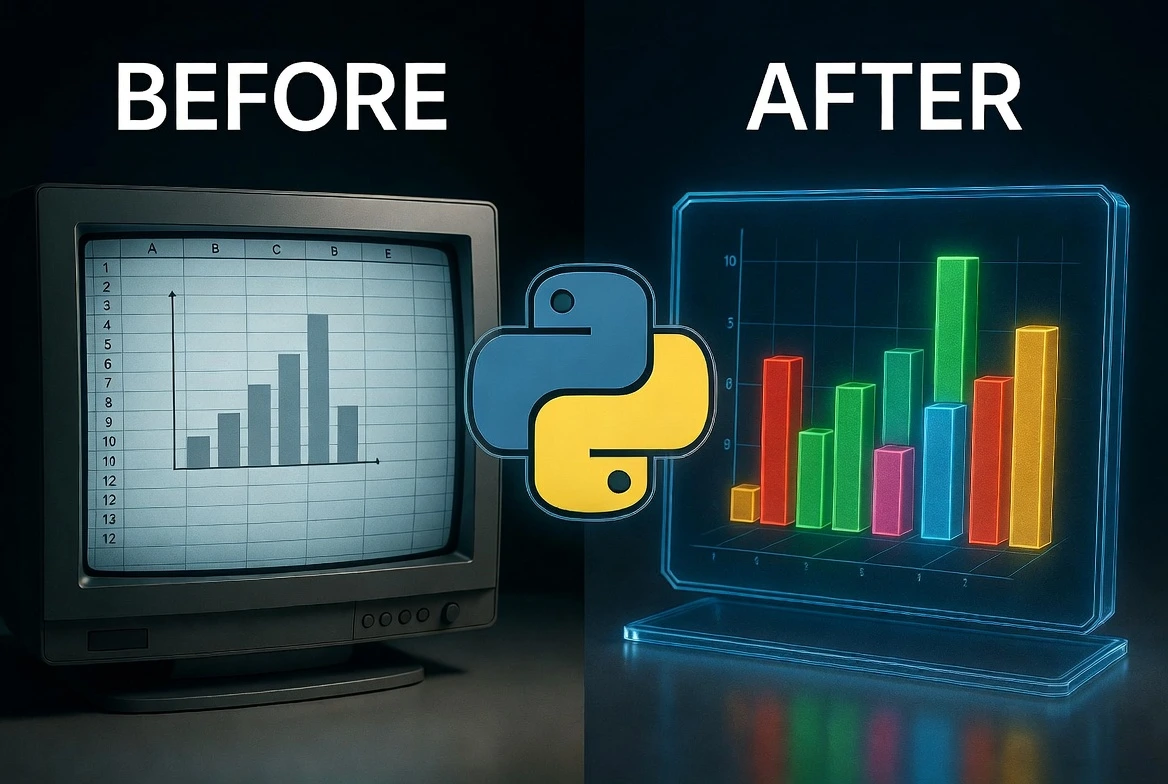
We have all been there. It’s end-of-month reporting time. You open Excel, highlight some rows, click “Insert Chart,” and spend 20 minutes fighting with formatting settings to make it look decent.
Next month? You have to do it all over again.
There is a better way. With Python, you write the code once, and it generates perfect charts forever. Today, we will build your first data visualization pipeline.
The Toolkit 🧰
We need two of the most famous libraries in the Python world. Open your terminal and install them:
pip install pandas matplotlib- Pandas: The “Excel of Python.” It handles loading and organizing data.
- Matplotlib: The artist. It draws the actual lines and bars.
Step 1: Create the Data 📉
Usually, you would load a CSV file (df = pd.read_csv('data.csv')). But to make this tutorial easy to test, we will create some dummy data right inside the script.
Create a file named chart_maker.py:
import pandas as pd
import matplotlib.pyplot as plt

# 1. Create dummy data (The "Excel Sheet")
data = {
    'Month': ['Jan', 'Feb', 'Mar', 'Apr', 'May', 'Jun'],
    'Sales': [12000, 15000, 11000, 19000, 22000, 25000],
    'Expenses': [10000, 11000, 10500, 13000, 14000, 16000]
}

# Convert dictionary to a Pandas DataFrame
df = pd.DataFrame(data)

# Show the data to prove it looks like Excel
print(df)
Step 2: Plotting the Chart 🎨
Now for the magic. We will create a simple line chart comparing Sales vs. Expenses.
Add this code to the bottom of your script:
# 2. Setup the Plot
plt.figure(figsize=(10, 6)) # Width: 10 inches, Height: 6 inches
# 3. Draw the lines
plt.plot(df['Month'], df['Sales'], marker='o', label='Sales ($)', color='green', linewidth=2)
plt.plot(df['Month'], df['Expenses'], marker='s', label='Expenses ($)', color='red', linestyle='--', linewidth=2)
# 4. Add "Makeup" (Labels and Titles)
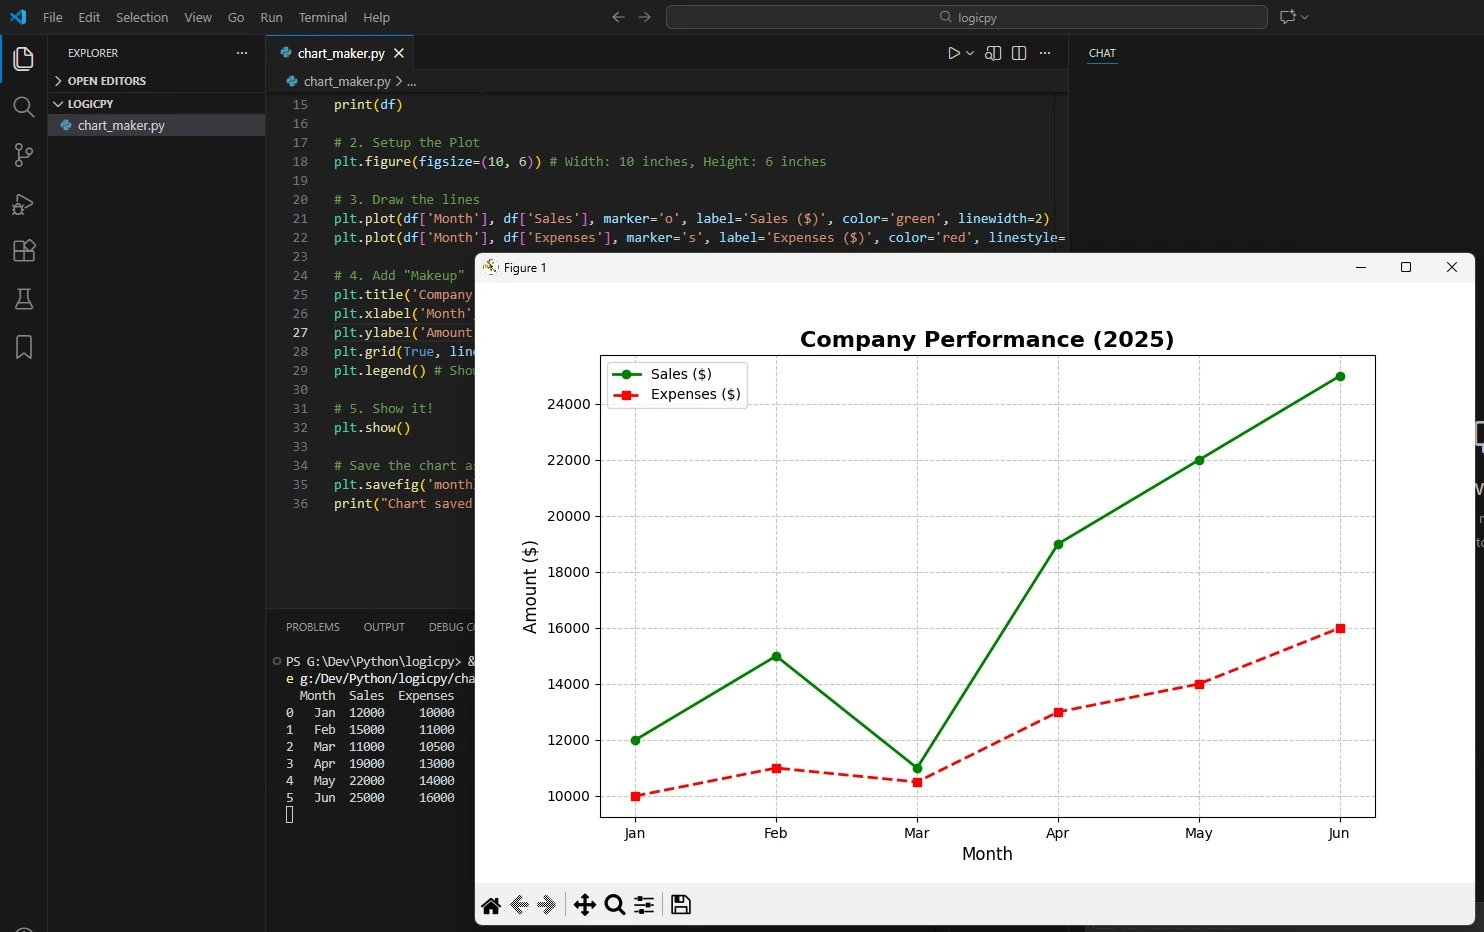
plt.title('Company Performance (2025)', fontsize=16, fontweight='bold')
plt.xlabel('Month', fontsize=12)
plt.ylabel('Amount ($)', fontsize=12)
plt.grid(True, linestyle='--', alpha=0.7) # Add a subtle grid
plt.legend() # Show the legend (Sales vs Expenses)
# 5. Show it!
plt.show()
Run the script. A window should pop up showing a crisp, professional line chart.
Step 3: Saving it Automatically 💾
The best part about Python is automation. You don’t need to take a screenshot of the chart. You can tell Python to save it as a high-quality image file.
Replace the last line (plt.show()) with this:
# Save the chart as a PNG file
plt.savefig('monthly_report.png', dpi=300)
print("Chart saved successfully!")
Now, every time you run this script, it updates the report image automatically.
Next Steps
You have just replaced a manual Excel task with an automated Python script.
But simple line charts are just the beginning. Tomorrow, we are going to get fancy. We will look at **Seaborn**, a library that makes charts look “modern” and “startup-ready” with just one line of code.
Get ready for: “Make Your Python Charts Look Like the New York Times with Seaborn.”
Want to make these charts look even better? Check out our Seaborn Aesthetic Upgrade Guide.
Frequently Asked Questions
Can I load my own Excel files instead of typing data?
Absolutely! That is the real power of Pandas. Instead of creating the dictionary variable, just use this line:
df = pd.read_excel('my_data.xlsx')Note: You might need to install an extra library by running pip install openpyxl to read Excel files.
Can I make bar charts instead of line charts?
Yes! It is a simple one-word change. Instead of plt.plot(), use plt.bar(). The rest of the code stays exactly the same.
Why does my chart look blurry when I save it?
This usually happens if the DPI (Dots Per Inch) is too low. In the savefig command, make sure you include dpi=300. This creates a high-resolution image suitable for presentations and printing.